
Easy Analysis of Molecular Weight Distribution via Graphical Interface
Create a Calibration Curve in Just Three Steps
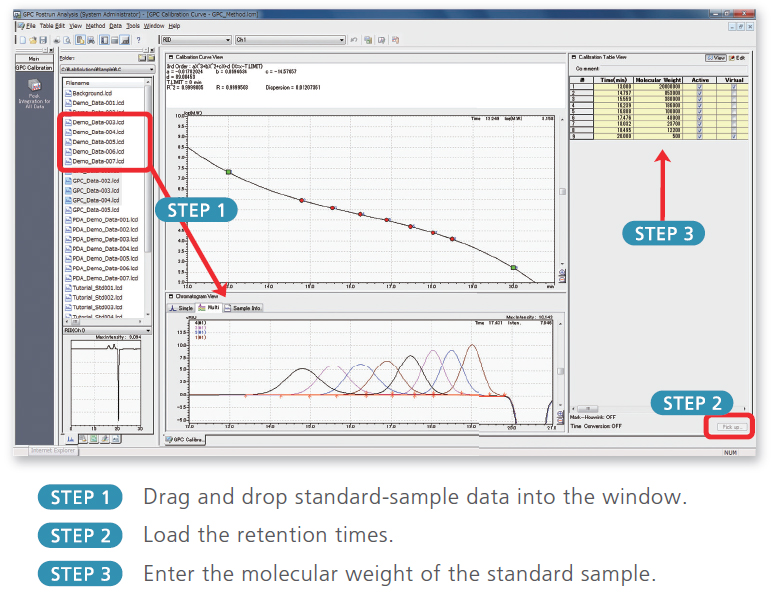
A maximum of 64 data points are available. Virtual points are also easy to set, and calibration curve appropriateness can be checked visually while choosing from a wide variety of approximation equations. Calibration curves can be corrected using the Mark-Houwink equation, and other correction methods based on Q-factors or degree of polymerization are available.
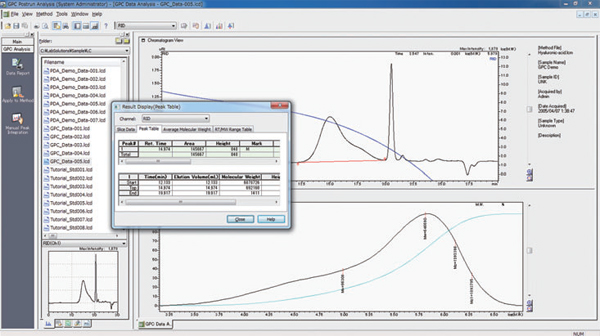
Graphical GPC Data Analysis Window
- Manipulation of peak integration possible by means of the graphical interface
- Management of data from multiple detectors within a single file
Because the molecular weight distribution curve is updated whenever peak integration is performed, results for mean molecular weight, intrinsic viscosity, polydispersity, and other parameters can be confirmed immediately. Time and detector sensitivity can also be corrected based on an internal standard peak or control sample.
Comments
0 comments
Please sign in to leave a comment.